
The financial markets are fast-paced, making them instrumental in accessing reliable data for building and testing trading strategies. Seamlessly integrating high-quality data into backtesting frameworks is invaluable for traders and analysts. TraderMade APIs provide traders and analysts with this capability by delivering accurate, granular, and comprehensive market data.
This article uses TraderMade's Time Series API to access historical data, implement a simple moving average (SMA) crossover strategy, and backtest its performance.
What is an SMA Crossover Strategy?
A moving average crossover strategy is a basic yet powerful technical analysis method. It involves tracking two SMAs:
1) A short-term SMA, which reacts more quickly to price changes.
2) A long-term SMA smoothens out short-term fluctuations.
When the short-term SMA crosses above the long-term SMA, it generates a buy signal, indicating upward momentum. Conversely, when the short-term SMA crosses below the long-term SMA, it generates a sell signal, suggesting downward momentum.
Data Collection
Start by installing TraderMade's SDK as follows:
!pip install tradermade
We use the installed SDK to fetch hourly time series forex data. The following Python code illustrates how to fetch currency pair EUR/USD data.
import tradermade as tm

import pandas as pd

def fetch_forex_data(api_key, currency, start_date, end_date,    interval="hourly", fields=["open", "high", "low", "close"]):


   # Set API key
   tm.set_rest_api_key(api_key)

   # Fetch the data
   data = tm.timeseries(currency=currency, start=start_date, end=end_date, interval=interval, fields=fields)


   # Convert data directly to DataFrame
   df = pd.DataFrame(data)

   # Convert 'date' column to datetime
   df["date"] = pd.to_datetime(df["date"])

   # Set 'date' as the index
   df.set_index("date", inplace=True)

   return df

# Adjust as needed
api_key = "YOUR TRADERMADE API KEY"
currency = "EURUSD"
start_date = "2024-11-01-00:00"
end_date = "2024-11-27-05:12"

# Fetch the data and display the first few rows
forex_data = fetch_forex_data(api_key, currency, start_date, end_date)
forex_data.head()
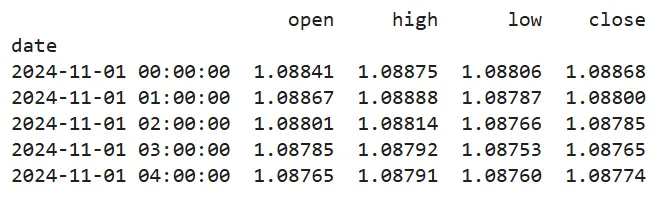
The data has been successfully fetched and preprocessed for Backtesting.
Implementing a Simple SMA Crossover strategy and Backtesting
This section uses the backtesting Python library to define and test our SMA crossover strategy. Here's a little background about the backtesting library for those who haven't heard about it. It's one of the most powerful and reliable Python frameworks for backtesting technical strategies such as SMA crossover, RSI crossover, Mean-reversal strategies, Momentum strategies, and more.
import numpy as np
from backtesting import Backtest, Strategy
from backtesting.lib import crossover
from backtesting.test import SMA

# Define the SMA crossover trading strategy
class SMACrossoverStrategy(Strategy):

       def init(self):
           # Calculate shorter-period SMAs for limited data
           price = self.data.Close
           self.short_sma = self.I(SMA, price, 20)  # Short window
           self.long_sma = self.I(SMA, price, 60)  # Long window

       def next(self):
           # Check for crossover signals
           if crossover(self.short_sma, self.long_sma):
               self.buy()
           elif crossover(self.long_sma, self.short_sma):
               self.sell()

   # Initialize and run the backtest
df = forex_data
df.rename(columns={"open": "Open", "high": "High", "low": "Low", "close": "Close"}, inplace=True)
bt = Backtest(df, SMACrossoverStrategy, cash=10000, commission=.002)
result = bt.run()

   # Display the backtest results
print("Backtest Results:")
print(result)
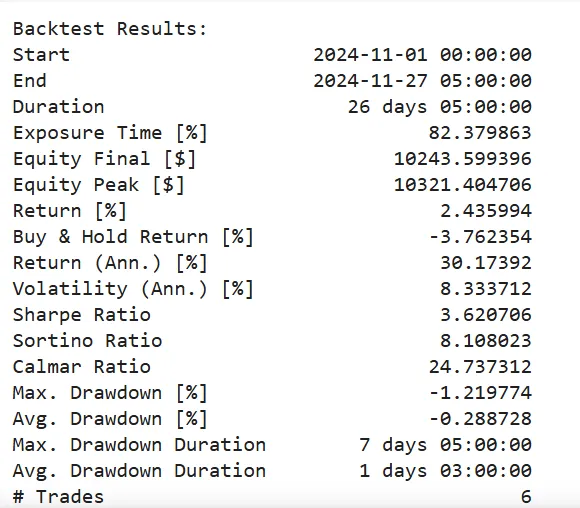
The strategy involves tracking two moving averages: a 20-period and a 60-period SMA. When the short SMA crosses the long SMA, it triggers a buy order. Conversely, when it crosses below, it triggers a sell order. Within 25 days, the simple strategy made a profit of $243 from 6 trades.
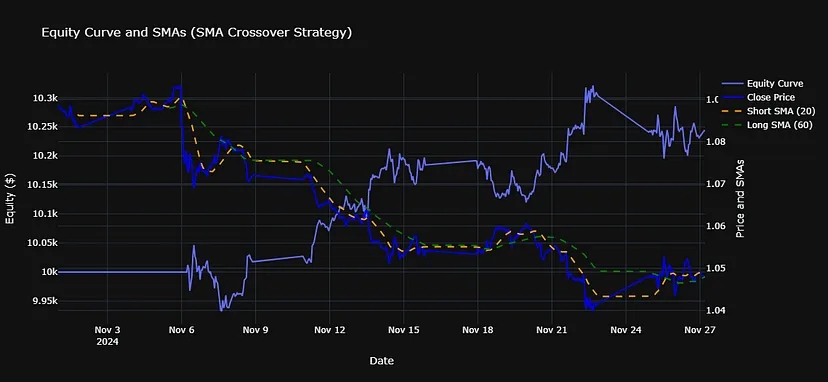
Equity and SMAs Curve
The Python code below evaluates the performance of the SMA crossover strategy. SMAs help visualize the price trends and the points of crossover that generate buy/sell signals. The equity curve helps evaluate the strategy's performance, showing how these signals affect portfolio growth.
Combining the two curves helps to easily observe how the crossover events correlate with the changes in portfolio value, providing critical insights into the efficacy of the SMA crossover strategy.
Plotly visualizes the equity and SMAs curves helping traders assess their strategy's profitability.
import plotly.graph_objects as go

# Plot equity curve and SMAs using Plotly

import plotly.graph_objects as go

fig = go.Figure()

# Add equity curve
equity_curve = result['_equity_curve']
fig.add_trace(go.Scatter(
   x=equity_curve.index,
   y=equity_curve['Equity'],
   mode='lines',
   name='Equity Curve',
   yaxis='y1'  # Link to first y-axis
))

# Add price with SMAs on a secondary y-axis
fig.add_trace(go.Scatter(
   x=forex_data.index,
   y=forex_data['Close'],
   mode='lines',
   name='Close Price',
   yaxis='y2',  # Link to second y-axis
   line=dict(color='blue')
))
fig.add_trace(go.Scatter(
   x=forex_data.index,
   y=forex_data['Close'].rolling(window=20).mean(),
   mode='lines',
   name='Short SMA (20)',
   yaxis='y2',  # Link to second y-axis
   line=dict(color='orange', dash='dash')
))
fig.add_trace(go.Scatter(
   x=forex_data.index,
   y=forex_data['Close'].rolling(window=60).mean(),
   mode='lines',
   name='Long SMA (60)',
   yaxis='y2',  # Link to second y-axis
   line=dict(color='green', dash='dash')
))

# Customize layout with two y-axes
fig.update_layout(
   title="Equity Curve and SMAs (SMA Crossover Strategy)",
   xaxis_title="Date",
   yaxis_title="Portfolio Value ($)",  # For equity curve
   yaxis=dict(title="Equity ($)", side="left"),
   yaxis2=dict(title="Price and SMAs", overlaying="y", side="right"),  # For price and SMAs
   template="plotly_dark",
   showlegend=True
)

# Show the plot
fig.show()
Final Thoughts
In conclusion, Backtesting requires accurate, high-frequency data, and TraderMade's APIs make this seamless. Whether you are a beginner experimenting with various strategies or a seasoned analyst building complex models, the company's products empower you with the appropriate tools.
Are you ready to integrate TraderMade's APIs into your workflow? Get started today and bring your ideas to life!