
Traders that use forex charts are often referred to as “Technical Traders,” and these charts serve as a guide on whether a financial instrument is trending up, down, or sideways and is based on using historical data.
Market participants from novices to experts use forex chart patterns, studies, oscillators, and line drawing functionality to create predictions & analysis so that Forex traders can act upon their trading strategy and execute buy or sell orders with their broker.
Once Forex traders understand the basics of forex charting and Technical Analysis, it is easier (although still very difficult) to understand why markets move in specific patterns and cycles. Trading chart patterns help traders understand market trends and make informed trading decisions.
What are Forex Charts?
Forex charts, or simply FX charts, are a graphical depiction of the historical behavior of a currency. It shows historical price and volume data for one or more currency pairs. Additionally, forex charting involves the historical behavior of currency pairs across various time frames. It is a forex graph with other significant parameters, like technical patterns, indicators, and overlays.
Understanding forex charts becomes crucial for traders and analyzers, as they provide a quick overview of price movement trends and help them draw meaningful trading strategies.
Types of Charts in Forex Trading
Using different timeframes, Traders can assess short-term price action alongside longer-term market direction by using a plethora of different types of charts.
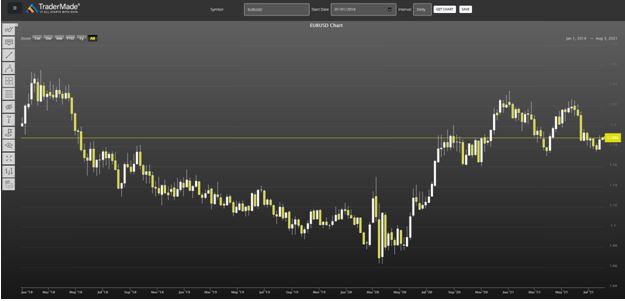
These include Candlestick charts, Bar charts, Trend Bar charts, Line charts, Heiken-Ashi charts with Market Profiles, and Point and Figure charts, with the Candlesticks method being the most popular.
This tried and tested Candlestick method of analyzing the financial markets has been used since the 18th Century by Sokyu Homma, a Japanese rice trader. It is still used today to predict particular market movements.
This graphical representation of price movement can be used over different timeframes and gives prices for the Open, High, Low, and Close of a particular period (for example, Daily, Weekly, 4-hour, 30 minutes, etc.)
Choosing the Best Charting Provider
When looking for a Charting provider, Traders should first understand the quality and sources of the data they want to analyze. As Forex data is Over-the-Counter (OTC), understanding how reliable and trusted this data is will be imperative to your success or failure.
Many providers may offer free forex charts. However, referring to trading charts forex based on poor-quality data and inconsistencies may harm your technical analysis and your trading decisions.
For example, TraderMade aggregates multiple feeds, which are blended into our unique, trusted, and reliable offering – and used by Institutional and Proprietary Traders from all over the globe. Therefore, our live forex charts with indicators have proven dependable and beneficial for users in many ways.
How to Read Forex Charts?
Now, let us briefly understand how to analyze forex charts. As discussed earlier, you must understand how to study forex charts for in-depth analysis and informed trading decisions.
Technical Traders use predominantly two types of indicators to create buy or sell signals for the Trader to act upon:
Studies or Overlays
These Technical indicators are plotted onto the Forex chart and give an instant visual representation of the particular study. Examples include Moving Averages, Fibonacci Lines, Keltner Channels, and Bollinger Bands.
Oscillators
Unlike the above Studies/Overlays, the Oscillators are plotted above or below the chart. Examples include MACD, Relative Strength Index (RSI), and Stochastics.
Trading Forex Charts in Technical Analysis
Forex traders often use many different Technical indicators and choosing which best suits their trading style can sometimes take a lot of trial and error back-testing. Then, traders can use these indicators with other techniques to create a feasible trading idea. Hence, rely on the best forex charts providing reliable and complete information.
Here is an example of a GBPUSD Daily Candlestick chart using 2 weeks of historical data, with a Bollinger Band (Period 20 & Standard Deviation 2) plus a MACD (26 periods) using the TraderMade Forex Portal:
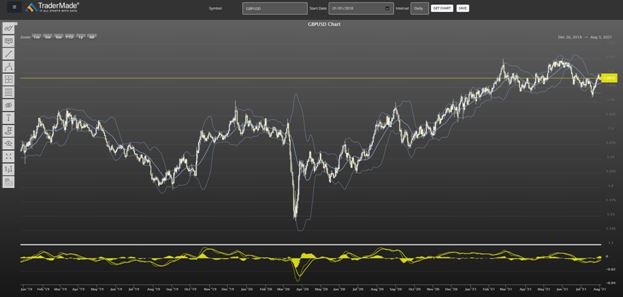
Bollinger Band and Moving Average
The Bollinger Band uses a Moving Average, a positive and negative pair of trend lines plotted 2 standard deviations aside from this Moving Average. As the prices are closer to the upper band, the market is presumed to be overbought, and the prices closer to the lower band, the more oversold the market is.
Moving Average Convergence/ Divergence (MACD)
The MACD assists Forex traders with the trend direction and momentum of that particular trend. When the MACD indicator is above 0, the price is supposed to be in an upward, bullish stage, whereas when the price is below 0, prices have entered a bearish phase.
The ‘Signal’ line accompanies the MACD line when the MACD line crosses the Signal line. This indicates prices are falling. When the MACD line crosses above the Signal line, the price is presumed to rise.
As you can see, there is plenty of information for each Study/Overlay and Oscillator to consume. Therefore, picking the correct Technical indicator at the right time is essential for a Forex trader to maximize market opportunities and ultimately attain success.
Also, looking at different chart patterns, for example, Continuation patterns like Flags, Pennants, Triangles, and Wedges, look for temporary interruptions of an existing trend and are also found on the TraderMade Forex Portal using this link https://research.tradermade.com/price-patterns. Other patterns include Reversal patterns, Head and Shoulders, Double Tops, Double Bottoms, and Gap Fills.
TraderMade Forex Portal Features
With over 100 Technical indicators, a wide range of line drawing functionality using our world-renowned quality, and trusted real-time and historical data, we want all market participants to excel.
Our forex charting is user-persistent. Thus, any work or changes our customers make are automatically saved and will be there when our Traders log back in again.
Being fully functional on mobiles, tablets, and desktops means that even when you are not in the office, you can still be kept fully up-to-date with all market moves at the click of a button.
With a vast instrument list of Forex, Equity Indices, Commodities, Precious Metals, and Cryptocurrencies ready to use immediately, sign up and register for a free no-obligation trial of the TraderMade Forex Portal for 30 days, and takes no more than a minute to register and log in.