

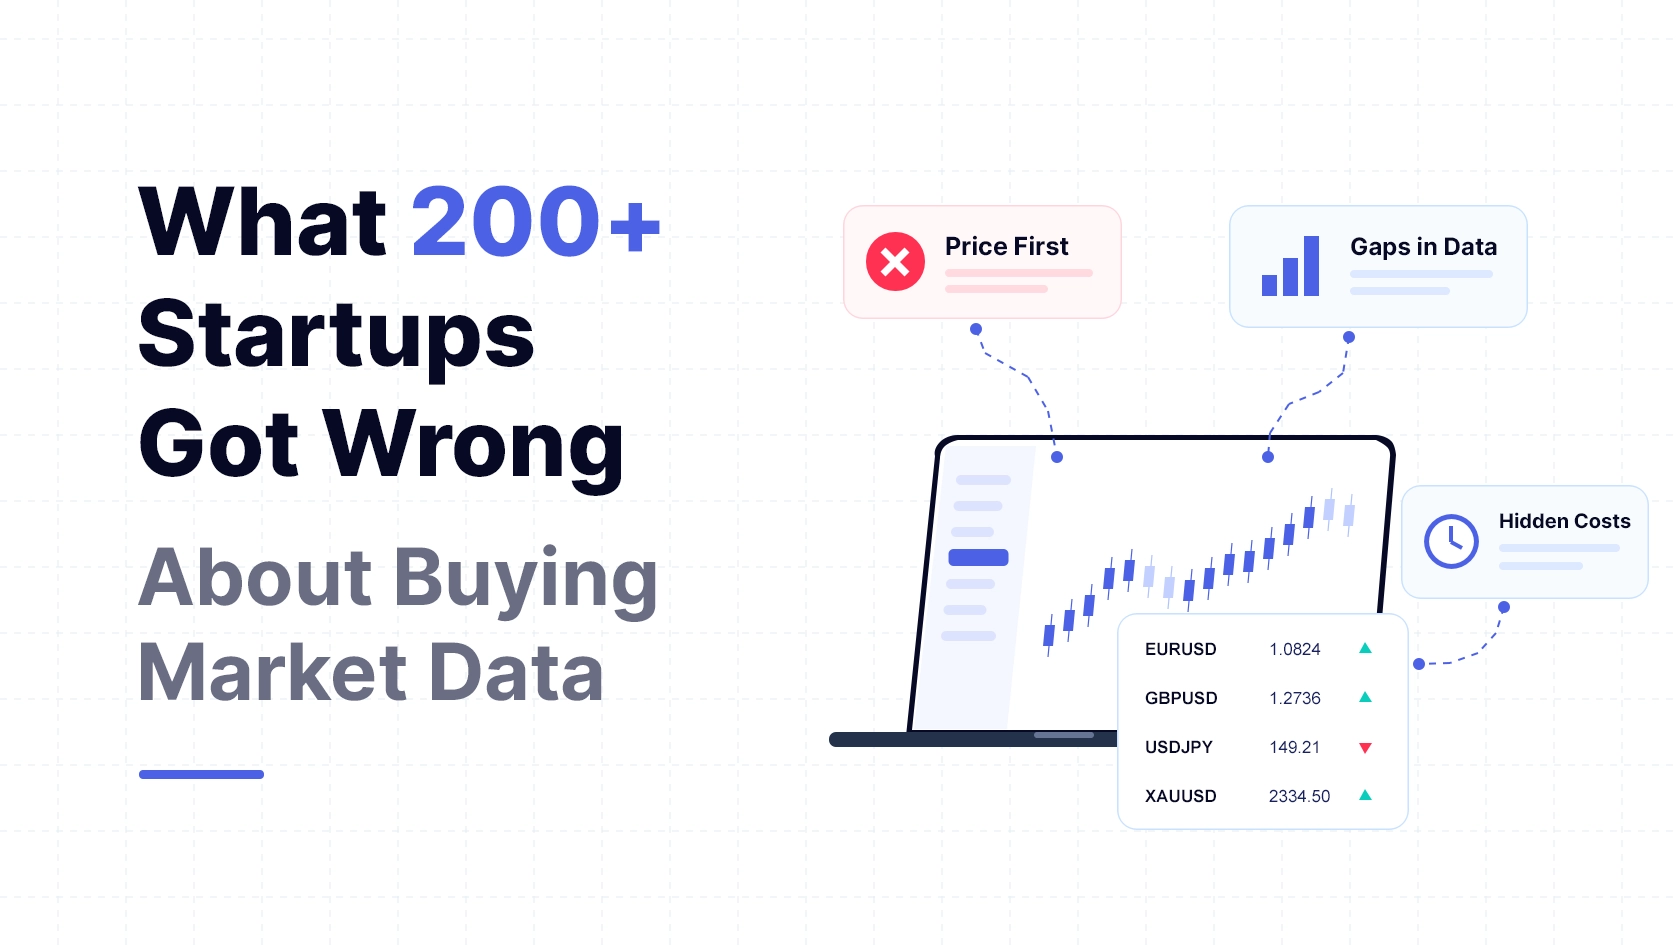
Key takeaways: * Price-first evaluation hides the real cost: The teams who chose a first provider on price alone were the ones who came back describing gaps, stale prices and the need for a second feed. * Experience changes the first question: Teams who had already run one feed opened with rights, gaps and failover, not price. * Data quality is brand trust: If a rate is wrong, users blame your app, not your vendor. * Rights before latency: Nearly a third of founders ask about display rights before they ask about speed.
The single most common mistake startups make when buying market data is opening with price.
In the last few months, more than 200 startups and early-stage firms came to us for data. We went back through every enquiry to see what they asked for, what went wrong post-launch, and what the smooth launches had in common. Two patterns stood out: almost everyone opened with subscription cost, and the teams who had already burned through one data provider opened with something else entirely.
Who was asking
| What they were building | Share |
|---|---|
| Trading platforms, brokers and prop firms | 41% |
| Charting, analytics and signal apps | 20% |
| Quant, algo and market-making systems | 17% |
| Payments, remittance and FX services | 12% |
| Treasury and corporate finance tools | 5% |
| Others | 4% |
About two thirds were building something their own customers would look at. More than a quarter were pre-launch or asked for startup terms, and three were not yet incorporated. That mix matters: a price on a customer's screen is a different product from a price in a spreadsheet.
Price is the first question, and usually the wrong one
A startup with twelve months of runway rationally asks what the feed costs first. But evaluating vendors on the subscription line alone hides the true cost of ownership. The teams who chose a first provider mainly on price described three bills that arrived later.
- The cleaning bill: Engineers writing code to detect and patch bad data, such as gaps in gold candles, instead of building the product.
- The second-feed bill: Paying a second vendor to cover for or validate an unreliable first feed.
- The rebuild bill: Replacing a retail aggregator after launch to get a feed that comes with the right to show prices to end users.
None of these appear on a pricing page. We set out the full model in the hidden cost of sub-standard market data; the short version is that the subscription is the smallest line in it.
Quality data is your brand
To your end user, the data is your product. They don't know who your vendor is; they only see your app. If a chart freezes, your software looks broken. If a phantom spike triggers a stop-loss or breaches a prop evaluation account, you deal with the dispute and the refund. If an FX rate doesn't match what a client sees at their bank, trust goes immediately. For trading platforms, prices are never decoration—they execute trades, mark margin, and decide whether a payout gets made.
Teams of every size came to us short on domain knowledge about symbol selection or market structure, and often only after their own users had started complaining about gaps or stale prices.
Data quality only shows up after launch
Before launch, every feed looks fine. A price arrives, a chart draws. Quality becomes visible when real customers and real money depend on it. These are the problems people described to us.
- Gaps in candles: Missing bars, or bars built from too few ticks, most often on gold and around the market open.
- Corrupted or stale prices: A bar with an impossible high, or a quote that stops updating while the connection still looks healthy.
- Reconstructed data: Spreads rebuilt after the fact rather than the bid and ask that were actually quoted. One research firm asked about this before anything else.
- Timestamps you cannot trust: One risk consultancy wanted the feed purely to cross-check timestamps against its other sources.
- Instruments that mean different things at different vendors: Some prices differ between providers because each handles underlying instruments in its own way. Teams find out when two charts disagree.
When the data is wrong, the cost is a support ticket, a refund, and a customer who tells others. Around one in ten enquiries named a quality problem, or a provider they were leaving, in the very first message. We wrote about what "Tier 1" should mean in this explainer.
Other things we did not expect
Rights come before latency. Nearly a third raised the question of showing prices to their own users in their first message, well ahead of anyone asking about speed. If your customers will see the number, settle that first.
Gold is the most requested instrument after the FX majors. About one in five named metals, and several wanted spot gold (XAU/USD) and nothing else: dealers, signal services, trading terminals.
Live first, history to fill the gaps. Most teams wanted the live price as the product and history only to backfill a dropped connection. The quant and backtesting firms, about one in seven, were the ones there for the archive itself.
The same architecture keeps appearing. One server-side connection to the feed, prices stored on the startup's own servers, then pushed to users over its own channel. It is a sound design. It also raises three questions worth answering early: what you may display, what you may store, and how you recover when your one connection drops.
Testing and talking. Around one in seven asked for a trial in the first message, to see the data against their own symbols. A short call before the trial tends to sort out rights, symbols and the right plan first, so the test checks the feed rather than the paperwork.
What the teams that moved fastest sent us
About half of first messages were a sentence or two: "I need data for my platform." Those began with a round of questions back. The ones that moved quickly arrived with seven things. Copy this for your own vendor shortlist.
- The build: what you are building and who will see the price, your team, logged-in customers, or the public.
- The instrument list: exact symbols, not "FX and some CFDs".
- Update frequency: every tick, every second, or every few minutes.
- History: how many years, at what granularity, and tick or bars.
- User scale: users now and in a year, tens, hundreds or thousands.
- Data purpose: charting, quoting, execution, risk marking, or an audit record you may be asked to produce.
- Timeline: building, in beta, or live and switching.
Then test for the things that hurt later. Watch the first hour after the weekend. Check a week of one-minute gold candles for gaps. Drop your connection on purpose and see what it takes to recover. Compare the rate with what your customers see at their bank.
How we counted
The percentages come from over 92 startups whose written enquiries over the last few months had enough detail to categorise. Calls, shorter emails and sign-up conversations shaped the observations, which totalled 205 companies. Students and hobbyists were left out.
If you are at the build stage, test live endpoints in the API playground, and our startup programme covers the period before launch.