
We have all heard of the old adage “buy low, sell high” in the financial markets – but in reality, this is much easier said than done! Predicting where the markets will move, even with all of the technical aids and tools that traders use, is the reason why only a select few succeed in their trading careers. Even when the trader has predicted the correct market direction, the markets can tend to overshoot on both the upside and downside and test previous market highs and lows.
As the financial markets are made up of both buyers and sellers, this ‘herd’ mentality and instinct drives the moves both up and down. If the trader can be patient and manage their risk/reward appropriately, then in theory buying near market lows and selling near market highs are possible.
But as the price action reflects the mood and emotions of the market participants, planning and executing a successful trading strategy can sometimes be very difficult to achieve on a consistent basis. More information on trading strategy can be found here in our previous article Tips for Traders. But, if traders are aware of both short-term and long-term previous market highs and lows, then the odds are weighted more towards the trader who has done their research and understood why markets move and stop in certain situations. The market reaction at these previous high/low prices will determine if the market holds or pushes through these previous levels.
A stronger alert would be for markets that contain longer periods of time, whereas alerts that contain only a small amount is historical data will, in theory, give weaker market indications.
The TraderMade Forex Portal contains a market high/low tool, it gives an instant alert once a previous high or low has been hit – therefore giving the trader an immediate and actionable piece of information that could have big repercussions on the profit/loss. Here is a recent example of GBPAUD monthly low which has been hit at 1.867;
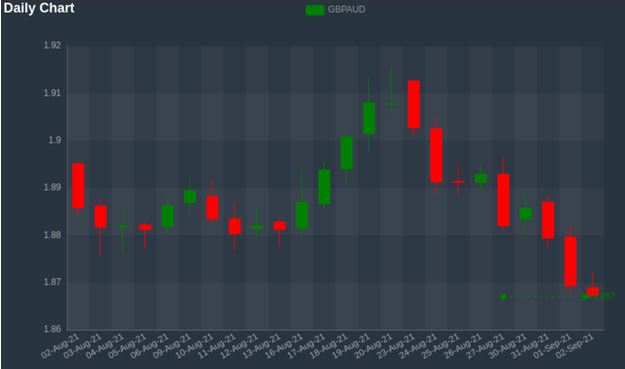
In this example, as being a monthly low, traders should be aware that this monthly low price of 1.867 could be a potential reaction point, so either the market to test and retrace to the upside – or trade through this price and look for further traction on the downside. Only time will tell to see how this market reacts and if this 1.867 price is important moving forward, but traders should be aware of this type of market movement.
Another example of potentially a stronger alert is that of this recent USDTRY 3-month low at 8.2724 as shown below;
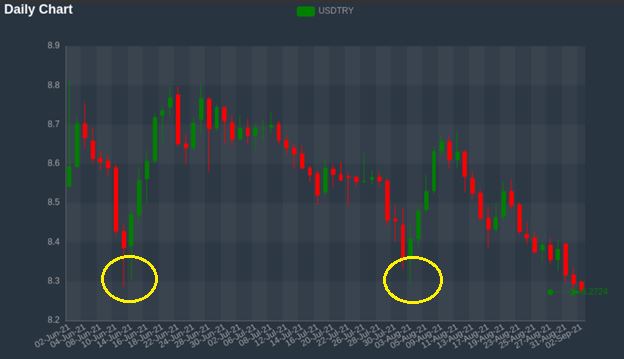
This USDTRY example shows that around the 8.3000 level has been tested twice before (around the 14th June & 3rd August as highlighted above) but did not trade and close below this price. This Daily chart shows the market trend to the downside and a clear break and hold below 8.2724 could open up a further downside move therefore traders should be aware of this type of price action.
Combining the previous market Highs and Lows with other Technical Analysis methodologies like Charting and Market Profile, traders can now build a picture and a story on how a particular market will potentially perform in the short and longer term.
Using previous market highs/lows and searching for double and triple bottoms, is undeniably a tool that traders should be looking out for and applying within their strategy.
Now you can find this instant market information directly, alongside live streaming Forex, Equity Indices, Stocks, Precious Metals and Cryptocurrency data and charting, live fundamental news and other pattern recognition tools at the TraderMade Forex Portal – click this link for a no-obligation trial or live chat with one of the teams to know more.